Tell us about the job
Takes about a minute. No obligation.
A contractor quoting water heater installation in Palo Pinto County has to account for what the local climate actually demands, and that starts with the severity of weather this area sees. 90 severe weather events were recorded in Palo Pinto County, Texas between 2015 and 2024. At roughly the midpoint nationally, this is a county where severe weather is a real but not dominant factor in equipment wear. A water heater that has failed here is more likely reflecting how it was originally sized and installed, or how sediment has accumulated over the years, than a weather load that overwhelmed it. Contractors size and spec accordingly.
The ductwork question does not apply to a water heater job, but the electrical does. Half the homes in Palo Pinto County, Texas were built in 1979 or earlier (2020-2024 ACS 5-year). A house built by that year was wired for the loads of that era, and a new water heater, particularly an electric heat pump model, can draw more than an older panel was laid out to handle. A contractor pricing the installation has to look at the service panel and the circuit before the unit goes in, because that is where an otherwise straightforward job can expand in scope.
What a Water Heater Installation Puts in Your Home
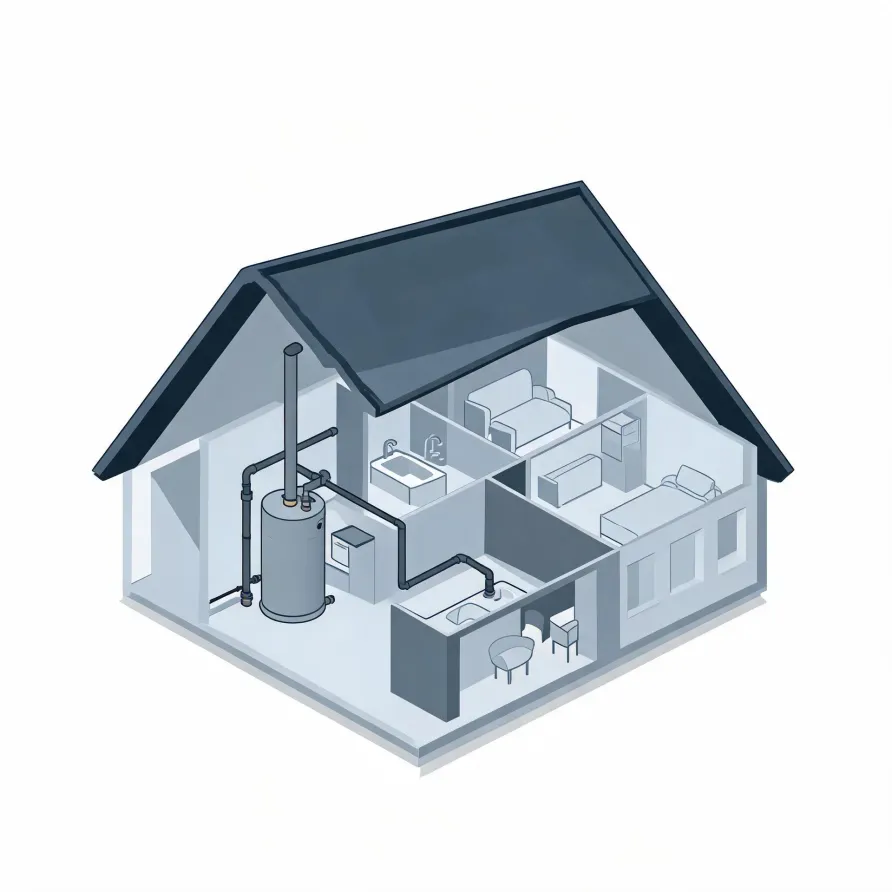
The tank or tankless unit is the heart of the system. A storage tank sits in a utility closet, garage, or basement and holds a reserve of heated water ready for use. A tankless unit mounts to a wall and heats water on demand as it passes through the unit.
Connected to the unit are the cold-water inlet, the hot-water outlet, and the pressure relief valve, which sits on the side of the tank and releases pressure if it climbs too high. A gas-fired unit also has a flue pipe that exits through the wall or roof, while an electric unit connects directly to a dedicated circuit.
The drawing shows a typical layout, and a licensed contractor determines what the installation requires in your specific home.
Find a contractor in Palo Pinto CountyPalo Pinto County, by the record
90 severe weather events were recorded in Palo Pinto County, Texas between 2015 and 2024.
NOAA National Centers for Environmental Information, Storm Events Database, bulk CSV export, events 2015-01-01 through 2024-12-31.Half the homes in Palo Pinto County, Texas were built in 1979 or earlier (2020-2024 ACS 5-year).
U.S. Census Bureau, 2020-2024 American Community Survey 5-Year EstimatesPalo Pinto County, Texas holds 15,206 housing units (2020-2024 ACS 5-year).
U.S. Census Bureau, 2020-2024 American Community Survey 5-Year EstimatesOwners occupy 71.0% of the occupied homes in Palo Pinto County, Texas (2020-2024 ACS 5-year).
U.S. Census Bureau, 2020-2024 American Community Survey 5-Year EstimatesSevere Weather Events in Palo Pinto County
Extreme weather puts a real load on water heating equipment, pushing it harder and shortening the window before repairs or replacement become necessary. How often that happens here shapes what a water heater in Palo Pinto County needs to handle.
90 severe weather events, 2015–2024. Source: NOAA National Centers for Environmental Information, Storm Events Database.